Data analyst interview questions and answers for freshers (2026 guide)

Breaking into data analytics as a fresher can feel challenging because interviews are designed to assess both your knowledge and your approach to solving problems. Recruiters expect candidates to understand the data analysis process, articulate their learning journey with confidence, and demonstrate clear, structured thinking during discussions.
This guide helps you prepare for real interview scenarios with data analyst interview questions tailored for freshers, including technical, SQL, Python, statistics, Excel, and BI tool questions. Each section includes practical Q&A-style explanations to help you grasp concepts and present them confidently during interviews.
Table of Contents
1. What Does a Data Analyst Do?2. Skills Needed to Get a Data Analyst Job
3. General Data Analytics Interview Questions
4. Data Analyst Technical Interview Questions
5. SQL Interview Questions for Data Analysts
6. Python Interview Questions for Data Analysts
7. Statistics Interview Questions for Data Analysts
8. Excel Interview Questions for Data Analysts
9. Power BI / Tableau Data Analyst Interview Questions
What does a data analyst do?
Before answering any data analyst interview questions for freshers, it is important to understand how the role functions in real workplaces. A data analyst transforms raw data into meaningful insights, identifies data patterns, and supports data-driven decision making.
Employers expect analysts to clean data, conduct exploratory data analysis, validate data quality, and communicate findings using data visualisation tools.
For a detailed explanation, see: what does a data analyst do
💡 Pro Tip: Anchor your explanation with a brief project example, it demonstrates practical understanding and immediately strengthens your credibility.
Knowing the day-to-day realities of the job sets the context, but the real advantage comes from developing the skills that let you deliver those outcomes consistently.
Skills needed to get a data analyst job
Freshers preparing for data analytics interview questions often focus on tools, but the role demands a broader mix of analytical thinking, data handling abilities, and strong communication.
What matters most is your ability to take raw information, apply structured analytical methods, and convert those findings into insights that genuinely influence decisions.
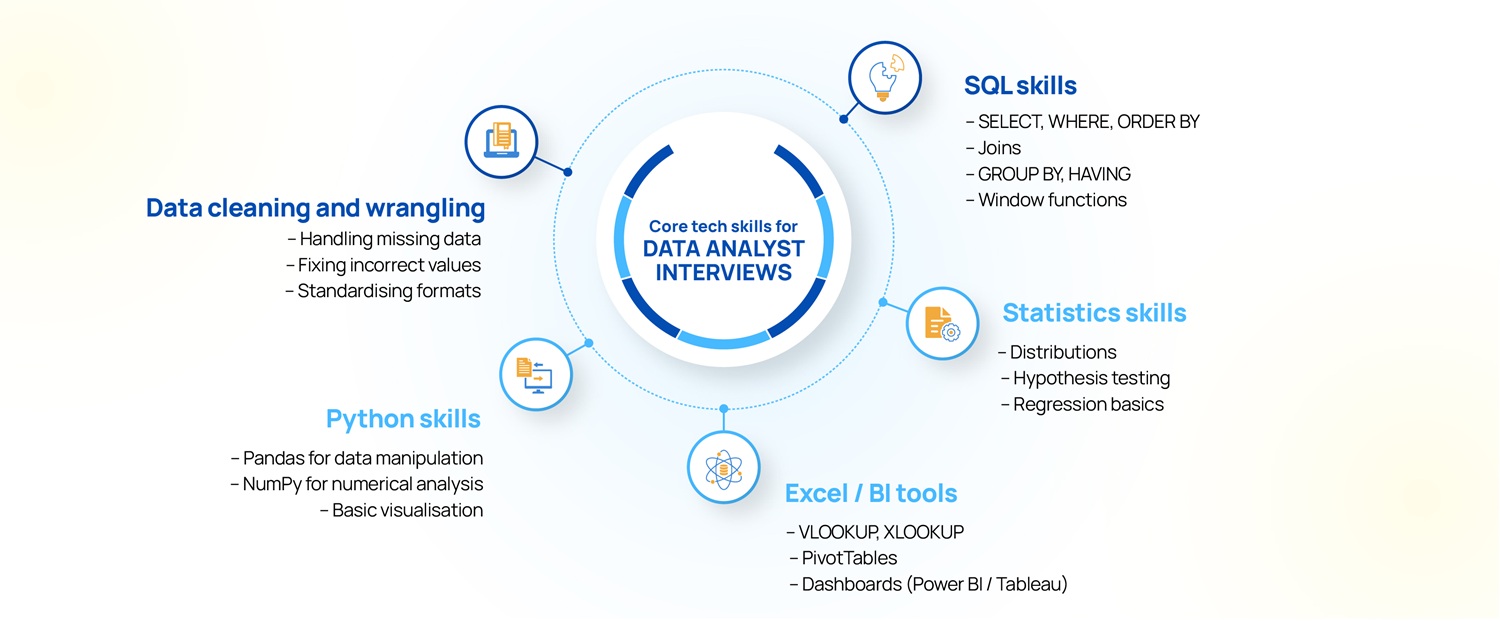
Essential capabilities employers look for:
- Data cleaning and data wrangling to handle missing data, inconsistent data, and incorrect data values
- Statistical analysis and interpretation, including summary statistics, probability, hypothesis testing, and understanding distributions
- SQL proficiency for querying databases, joining tables, performing aggregations, and analysing large datasets
- Python for data analysis, using libraries like Pandas and NumPy for data manipulation, EDA, and data transformation
- Data visualisation using Excel, Power BI, Tableau, or other data visualisation tools to present insights clearly
- Understanding of data modelling, schemas, relationships, and normalisation concepts
- Data profiling and data validation to ensure data integrity throughout the analysis process
- Ability to interpret complex data sets and identify meaningful patterns or trends
- Strong communication and storytelling skills to explain insights to non-technical stakeholders
Learn the full pathway here: How to Become a Data Analyst
💡 Pro Tip: Show that you understand why each skill matters. When you link a skill to the business decisions it enables, you instantly stand out from candidates who only focus on tools.
General data analytics interview questions
HR rounds focus less on formulas and more on how freshers think about the data analysis process. Interviewers test your understanding of the data analyst role, your approach to data collection, and your ability to communicate insights.
These interview questions help employers assess curiosity, analytical thinking, and how well you collaborate during data-driven projects.
More guidance here: interview questions for freshers
How would you describe the role of a data analyst?
A data analyst interprets raw data, identifies trends through univariate, bivariate, or multivariate analysis, and transforms information into insights that support business decision-making.
The role involves cleaning categorical and numerical data, analysing patterns, validating data quality, and presenting findings using data visualisation tools.
Analysts also help define the dependent variables and metrics needed for accurate business evaluation.
How to discuss your learning journey and projects in data analysis?
Explain how you learnt core concepts by working on small data analysis projects involving EDA, handling categorical data, performing cluster analysis or factor analysis, or applying basic statistical techniques like univariate or bivariate analysis.
Mention tools or techniques you used for analysing data and how each project strengthened your understanding of real-world datasets.
How do you demonstrate problem-solving without work experience?
Use academic tasks or personal projects where you applied analysing data techniques such as summarising data, building a simple regression model with a defined dependent variable, or testing assumptions using exploratory analysis.
Even small wins like identifying patterns across three or more variables show structured thinking.
How to communicate insights effectively?
Focus on the relationships between variables and simplify concepts like bivariate analysis, trends, or what changed in a dependent variable.
Use clear visuals, especially when presenting insights involving three or more variables or clusters identified during EDA.
What soft skills matter for data analysts?
Interviewers look for curiosity, attention to detail, structured thinking, adaptability, and collaboration.
Since analysts often handle missing or inconsistent data, patience and a proactive approach are equally valued. They also expect clarity in communication and willingness to question assumptions.
General questions show your potential, but technical rounds expose your capability, the point where interviewers look for depth, discipline, and a clear analytical framework.
Data analyst technical interview questions
Technical rounds go deeper into concepts like data wrangling, data validation, exploratory data analysis, and handling missing values. These data analyst questions assess your ability to clean datasets, identify patterns, transform data, and ensure data integrity throughout the analysis workflow.
Freshers should show clarity in explaining statistical techniques, data modelling basics, and how to analyse large datasets efficiently.
Can you explain the complete data analysis workflow?
A strong analyst does not treat analysis as a set of disconnected steps, they see it as a sequence where every stage influences the next. Interviewers want to know if you understand this flow: how you move from a vague problem to structured data, and then to insights that actually answer the question.
Your explanation should show that you can keep the business goal in focus while working through the technical details.
A typical workflow includes:
- Understanding the business question
- Collecting data from relevant data sources
- Cleaning and preprocessing raw data
- Handling missing values, duplicates, and incorrect data values
- Exploring data with summary statistics and visualisation
- Identifying patterns and relationships
- Building statistical models if required
- Presenting insights to stakeholders
This demonstrates how you approach analysing data logically from start to finish.
What are the key steps involved in data cleaning?
Steps include correcting data entry errors, removing duplicates, standardising formats, fixing data types, handling missing data, and validating data integrity. Data cleaning improves data quality and ensures reliable outputs.
How do you handle missing values and outliers?
Common techniques include deletion (listwise or pairwise), imputation (mean, median, mode), predictive modelling, or using domain knowledge. The method depends on the data structure, volume of missingness, and business context.
What data types do you commonly encounter?
You frequently handle categorical data, numerical data, time-series data, and mixed formats. This determines whether you apply univariate analysis, grouping, or transformations before moving into more complex modelling.
What is data modelling?
Data modelling is the process of organising data using schemas, relationships, and rules to ensure clarity and efficiency. Analysts often work with star schemas, snowflake schemas, or ER diagrams.
What are database relationships?
Databases use one-to-one, one-to-many, and many-to-many relationships to define how tables connect. Understanding relationships helps when performing joins or analysing relational datasets.
What is normalisation and denormalisation?
Normalisation organises data into logical tables to eliminate redundancy. Denormalisation does the opposite to improve read performance. Interviewers want to assess your reasoning for choosing one approach over another.
How do you validate data quality?
Checks include verifying completeness, accuracy, consistency, validity, uniqueness, and timeliness. Analysts also use data profiling tools to inspect distributions, missing values, and anomalies.
What is exploratory data analysis (EDA) fundamentals
EDA involves summarising data visually and statistically to understand patterns, distributions, and relationships between variables. Analysts use histograms, box plots, heatmaps, scatterplots, and summary statistics.
How would you analyse a drop in sales for the last quarter?
- Examine sales data by region, product, and time period
- Investigate missing or incorrect data values
- Check for external factors like price, competitor behaviour, or seasonality
- Identify patterns using visualisation
- Recommend insights backed by evidence
Scenario questions reveal your practical approach to data-driven decision-making.
A well-structured workflow means little without the technical precision to support it, which is why SQL becomes the foundation of most analyst interviews.
SQL interview questions for data analysts
SQL forms the backbone of most data analytics interview questions because analysts spend significant time querying relational databases. Interviewers examine how well you understand joins, aggregations, data storage structures, filtering, window functions, and methods to fix incorrect data values.
Strong SQL skills show that you can extract, combine, and summarise data points from multiple tables with accuracy and speed.
What is Structured Query Language (SQL)?
SQL (Structured Query Language) is used to query and manipulate relational databases. Analysts use it for filtering, joining, grouping, summarising, and transforming data.
What are the common SQL commands used in daily analysis (SELECT, WHERE, ORDER BY)?
SELECT retrieves data from a database. WHERE filters rows, and ORDER BY sorts the results in ascending or descending order.
What is an INNER JOIN?
An INNER JOIN retrieves matching records from two tables based on a related column. It is the most commonly used join.
What is the difference between GROUP BY and HAVING?
GROUP BY groups rows into summary rows. HAVING filters groups after aggregation. WHERE cannot be used on aggregated results.
What is a subquery?
A subquery is a query within another query, useful for filtering results based on dynamic conditions.
What is ROW_NUMBER() and window functions?
ROW_NUMBER() assigns a unique number to each row in a window partition. Window functions help with ranking, running totals, and time-series analysis.
How do you extract the year from a date column?
Examples:
- SQL Server: YEAR(date_column)
- MySQL: YEAR(date_column)
- PostgreSQL: EXTRACT(YEAR FROM date_column)
How do you handle NULL values?
NULL values represent missing data, so the first step is to understand why the value is missing and how it affects the analysis.
Analysts typically use functions like COALESCE, IFNULL, or NVL to replace NULLs with an appropriate default, such as a mean, median, mode, or a domain-specific placeholder, ensuring the dataset remains reliable for further analysis.
How do you find the second highest salary?
You can retrieve the second highest salary by using a subquery that filters values below the maximum salary, or by applying a window function like RANK() or DENSE_RANK() to order salaries and select the row with rank 2.
Both approaches work well when analysing data with duplicates or repeated values.
How do you improve SQL performance?
Efficient SQL relies on smart indexing, clean query structure, and early data filtering to minimise resource use. Examining the execution plan helps pinpoint delays and guides improvements that make the query run smoothly.
SQL proves you can access and organise information, but interviews also dig into how you process that information end-to-end, making Python the natural next area of evaluation.
Python interview questions for data analysts
Python interview questions for data analysts often explore your ability to manipulate structured and unstructured data using libraries like Pandas, NumPy, and Matplotlib.
Recruiters expect you to know how to clean datasets, handle missing data, perform data transformation, conduct EDA, and write efficient code. Python skills demonstrate how you automate tasks, analyse large datasets, and apply statistical methods to real data.
What is Python used for in data analysis?
Python is widely used for data wrangling, statistical analysis, and exploratory data analysis because of its flexible syntax and powerful libraries. It also supports automation and machine learning workflows, making it a reliable tool for handling both simple and complex datasets.
What is the difference between a list and a tuple?
Lists are mutable, allowing you to modify elements after creation, whereas tuples are immutable and remain fixed once defined. Tuples are also slightly faster, which makes them useful when handling constant values in analytical tasks.
Why are loops important?
Loops are essential for iterating through data efficiently and automating repeated operations. They help analysts process large datasets, apply logic across records, and structure data workflows more cleanly.
How do you load a CSV file in Python?
You can load a CSV file using Pandas by calling pd.read_csv(), which reads the data into a DataFrame for easy manipulation. This format is ideal for cleaning, filtering, and transforming data during analysis.
How do you remove duplicates in Pandas?
Duplicate rows can be filtered out using the library’s built-in cleaning options, ensuring that only unique records remain. This keeps the dataset consistent and prevents misleading insights.
What is NumPy used for?
NumPy provides fast numerical computing through vectorised operations and multi-dimensional arrays. It is particularly useful when performing mathematical calculations or preparing data for machine learning models.
How do you view summary statistics?
You can generate summary statistics using df.describe(), which gives a quick overview of distributions, counts, and key metrics. This is often the first step in understanding the structure and behaviour of a dataset.
How do you create a bar chart in Matplotlib?
A bar chart can be created using plt.bar(x, y), followed by plt.show() to display the output. It’s a simple way to compare values across categories during initial data exploration.
How do you optimise Python code?
Performance improves when the code is written to work with Python’s strengths rather than against them, relying on efficient structures and reducing row-by-row operations wherever possible.
Thinking in terms of reusable, modular logic not only speeds execution but also makes the entire analysis pipeline cleaner and easier to scale.
You notice missing data in a dataset. How do you address it?
Start by identifying missing values using functions like df.isnull(), then choose an appropriate strategy such as imputation or removal based on the context. The goal is to preserve data quality without introducing bias into the analysis.
After demonstrating how you work with data programmatically, interviews move deeper into the reasoning behind your analysis, the statistical foundations that guide every conclusion you draw.
Statistics interview questions for data analysts
Statistical concepts are essential for analysing data and interpreting outcomes correctly. Interviewers frequently test your understanding of distributions, hypothesis testing, summary statistics, regression analysis, correlation analysis, and univariate, bivariate, and multivariate techniques.
These questions help employers assess whether you can apply the right methods to identify patterns and validate conclusions.
What is the difference between mean and median?
The mean reflects the overall average, while the median represents the central point in the data. The median offers a more reliable picture when the dataset contains outliers or extreme values, making it especially useful in skewed distributions.
What are the four measurement scales?
The four measurement scales are nominal, ordinal, interval, and ratio. Each scale determines the type of statistical methods you can apply and how meaningful comparisons between values can be.
What is standard deviation?
Standard deviation indicates how spread out the values are from the mean. A high value shows greater variability, while a low value suggests that most points lie close to the centre.
What is conditional probability?
Conditional probability measures the chance of an event occurring when another event has already taken place. It helps analysts understand dependencies and refine interpretations of real-world behaviour.
What is a normal distribution?
A normal distribution is a symmetrical, bell-shaped pattern where most values cluster around the mean. It is widely used because many natural and business processes naturally follow this form.
What is sampling bias?
Sampling bias occurs when the sample does not accurately represent the population, leading to distorted insights. It often stems from flawed selection methods or uneven participation.
What is the null hypothesis?
The null hypothesis states that there is no meaningful effect or difference between groups. Analysts test it to determine whether observed patterns are statistically significant or simply due to chance.
Is correlation equal to causation?
No. Correlation simply shows that two variables move together, while causation means one variable directly influences the other. Analysts must investigate context and supporting evidence before drawing conclusions.
What is regression analysis?
Regression analysis examines how a dependent variable changes in response to one or more predictors. It helps analysts quantify relationships, identify important drivers, and evaluate the impact of different factors, whether through linear or logistic models.
How do you identify outliers?
Outliers can be detected by examining deviations from typical ranges, comparing values against distribution-based thresholds, or using visual tools like box plots. The aim is to spot points that behave differently from the rest of the dataset.
With spreadsheet-level analysis covered, interviews shift to the BI tools that organisations rely on for real-time visibility, making this the natural next stage in your preparation.
Excel interview questions for data analysts
Despite the rise of advanced tools, Excel remains crucial for data profiling, quick analysis, and summarising data points. Interviewers often ask data analyst fresher interview questions about lookup functions, PivotTables, conditional formatting, handling large datasets, and using formulas for data aggregation. Excel proficiency helps analysts clean data, transform values, and prepare datasets for further analysis.
Which functions are most useful in analytics?
Functions that support lookups, conditional calculations, date handling, and text manipulation are especially valuable for analysis. They help you organise information, compare categories, and summarise data efficiently without switching tools.
How do you remove duplicates?
Excel provides built-in cleaning options that scan for repeated rows and remove them in seconds. This ensures your summaries and insights aren’t distorted by inflated or duplicated values.
Why is XLOOKUP better than VLOOKUP?
XLOOKUP offers greater flexibility, allowing you to look up values in any direction and handle mismatches more gracefully. This makes it more reliable when working with evolving spreadsheets or complex datasets.
What is a PivotTable used for?
A PivotTable helps you break down large datasets into clear summaries by grouping and aggregating information. It is one of the fastest ways to spot trends and compare categories without writing formulas.
How do you highlight values above average?
You can use conditional formatting rules that automatically compare each value with the dataset’s average and emphasise the ones that stand out. It’s a quick way to identify unusual or important patterns.
How do you improve performance?
Performance improves when you minimise heavy formulas, keep your data structured, and remove unnecessary elements. These steps make Excel more responsive, especially when working with thousands of rows.
What is SUMIFS?
It allows you to calculate totals based on multiple conditions, giving you precise control over what gets counted or summed. This is especially useful when analysing trends across different segments or categories.
How do you restrict inputs?
You can set validation rules that limit entries to specific formats, ranges, or categories. This prevents errors early and keeps your dataset consistent, especially when multiple people contribute to the file.
How do you autofill formulas quickly?
Excel allows you to replicate formulas instantly across rows or columns using simple automation features. It speeds up repetitive work and reduces the risk of manual mistakes.
How do you find duplicate records across two sheets?
You compare values between the sheets using Excel’s lookup or highlighting tools to flag matches or duplicates. This is a common task when merging datasets from different sources.
In most teams, Excel handles the groundwork, but dashboards drive decisions. Naturally, interviews shift from spreadsheet skills to your fluency with BI tools.
Power BI / Tableau data analyst interview questions
Data visualisation tools like Power BI and Tableau are central to presenting insights clearly. Interviewers often explore your understanding of dashboards, data models, filters, DAX (in Power BI), and best practices for summarising data visually. These questions test whether you can convert complex data sets into intuitive visual stories that support data-driven decision making.
BI tools like Power BI and Tableau help transform data into interactive dashboards and visual insights.
What is a dashboard?
A dashboard is a visual summary that brings important metrics, charts, and trends together in one place, helping users understand performance at a glance. Its purpose is to highlight what matters most and allow quick comparisons without digging through raw data.
What is DAX in Power BI?
DAX is a calculation language used to create custom measures and logic within Power BI models. It helps analysts add depth to their dashboards by turning raw data into meaningful, context-aware insights.
How do slicers and filters work?
Slicers and filters let users interact with the dashboard by narrowing data to specific categories, time periods, or segments. This makes exploration more intuitive and helps uncover patterns that might be hidden at a broader level.
What is data modelling in BI tools?
Data modelling defines how tables connect, ensuring that relationships reflect how the business actually works. A well-structured model improves the accuracy of calculations and makes dashboards behave predictably when users apply filters.
How do you publish dashboards?
Publishing dashboards involves pushing them to a shared workspace where teams can access, interact with, and collaborate on insights. This ensures consistent reporting and makes it easier to keep everyone aligned.
How do you design a dashboard for sales performance?
Start by highlighting the key metrics that reflect overall performance, then support them with trends, category-level comparisons, and interactive filters. The layout should guide the viewer naturally from what is happening to why it is happening.
💡Final tip for your next data analyst interview
Freshers should focus on explaining how they analyse data, ensure data integrity, handle missing or inconsistent data, and apply statistical techniques effectively.
Need resume guidance? Refer to data analyst resume for freshers.
Once you are comfortable with SQL, Python, statistics, and common data analytics interview questions, the next step is to apply your skills in real opportunities. Look for roles that let you work with real datasets, build dashboards, clean and transform data, and contribute to data-driven projects.
Check out available listings under: Data analyst jobs
Strengthen your interview preparation with MyCareernet
Preparing for your next data analyst interview goes beyond learning concepts — you also need the right platform to apply your skills, practise with real assessments, and access opportunities that match your strengths. MyCareernet connects freshers to employers, challenges, and resources designed to help you demonstrate your capabilities with confidence.
👉 Register now on MyCareernet for free and turn your data analysis preparation into real interview confidence.
MyCareernet
Author
MyCareernet brings expert insights and tips to help job seekers crack interviews and grow their careers.